Hi, I’m Yusof Bandar 2nd Year Computer Science Student currently on a Summer Internship with DigitalLabs for 3 months. Throughout my time here I will be uploading weekly diaries detailing my feelings and thoughts. [Read more…] about First Week At DigitalLabs
Latest
Take a peek at the Quantified Digital Labs Environment!
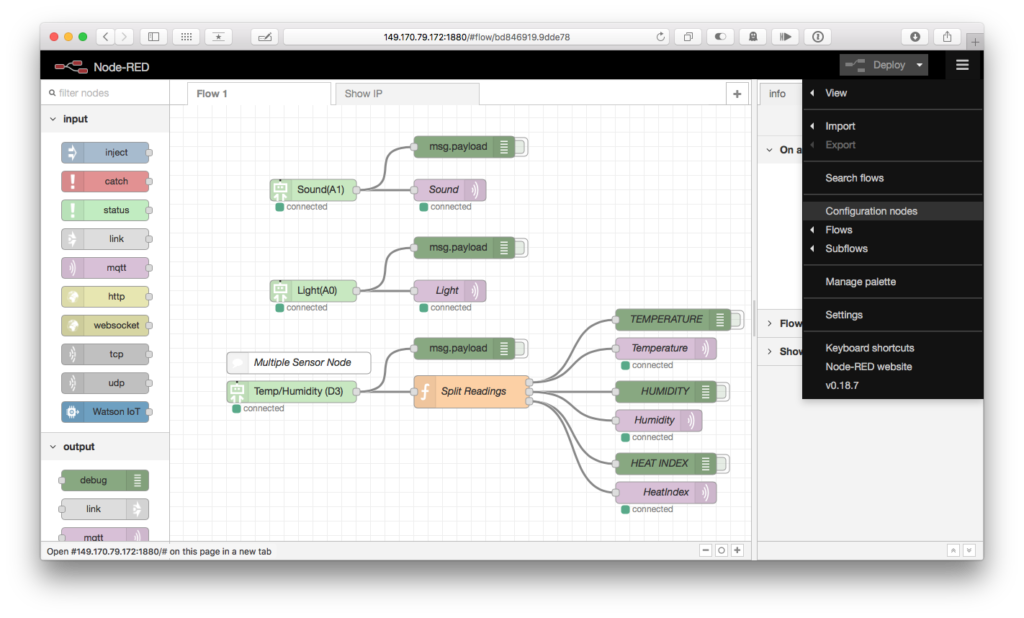
Here’s a quick dashboard we put together with Node-red and the Grove Pi+ sensor kit. We built a little on our previous project to pull in more environmental data, but by using our Heroku platform (with its bundled CloudMQTT broker) we have a free, web-hosted dashboard we can access from anywhere.
This is part of our series on Node-red; If you’d like to see more, see our Technology for Non-technologists post, or our series of posts on Node-red and sensors. [Read more…] about Take a peek at the Quantified Digital Labs Environment!
Using Node-Red to visualise sensor data over the internet without writing code: Addendum – MongoDB
Please see Part 1 and Part 2 of this series to take full advantage of this post!
Connecting to a MongoDB storage system
In this article, we’re going to take our Heroku-hosted flow and store inbound light data in a MongoDB instance, provided by Heroku when we provisioned our machine.
We’ll look at online and desktop tools to query our database and extract our data. [Read more…] about Using Node-Red to visualise sensor data over the internet without writing code: Addendum – MongoDB
Using Node-Red to visualise sensor data over the internet without writing code, Part 2
Please see Part 1 of this series to take full advantage of this post!
This time, we’re going to do something a little more useful with our sensor.
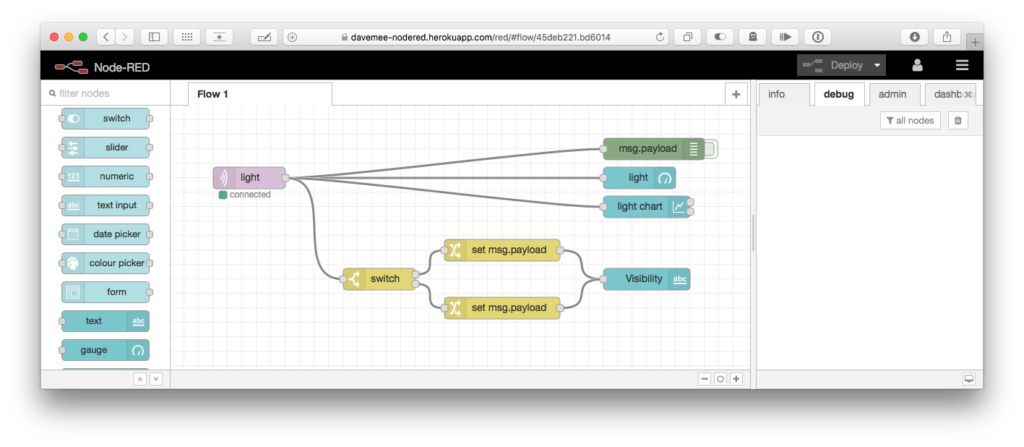
We’re going to push the data to a real-time publish/subscribe system online, using the Heroku platform. We will take this data and visualise it on a web accessible URL, where we will first present real-time data, and add a one-hour time series graph. We will then expand this into a dashboard, with a feedback message telling us about the light levels as text.
Nearly all of this we will achieve without writing any code, though we will see entry points where we can perform data manipulation if we needed to. [Read more…] about Using Node-Red to visualise sensor data over the internet without writing code, Part 2
Using Node-Red to visualise sensor data over the internet without writing code, Part 1
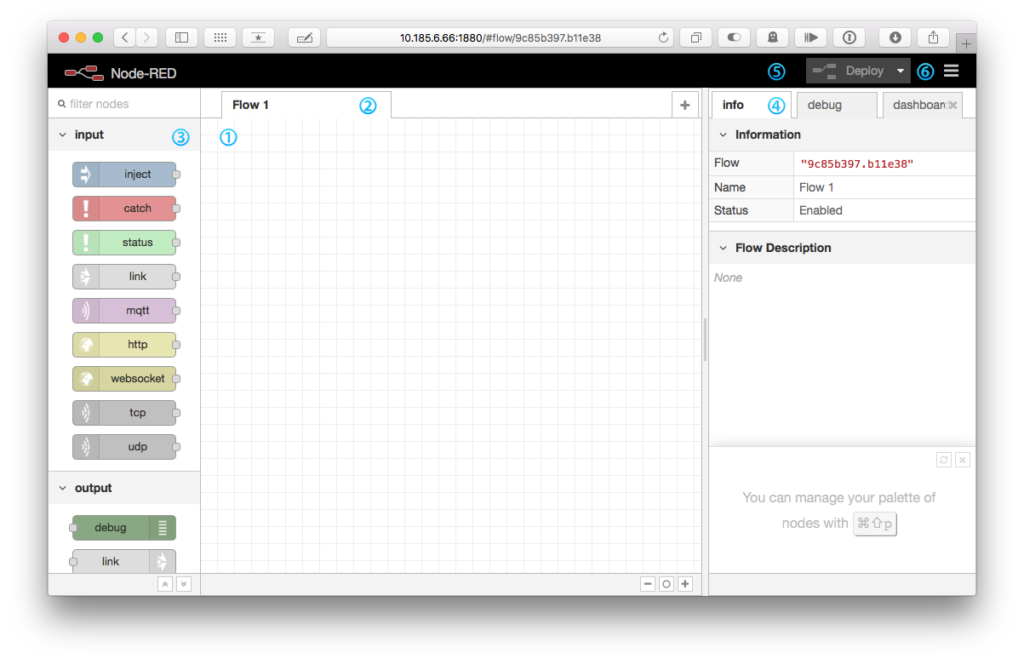
Using Node-Red to visualise sensor data over the internet without writing code, Part 1
This is the first article in a series from MMU’s Digital Labs looking at ways to empower researchers, students, and academics with powerful tools to aid and augment data gathering and processing activities. We’re using Node-Red, an environment that makes it easy to assemble highly functional logical blocks together to automate data processing without needing to write any code. [Read more…] about Using Node-Red to visualise sensor data over the internet without writing code, Part 1