• Skip to main content

DigitalLabs@MMU

Digital enterprise at Manchester Metropolitan University

  • Home
  • About
    • Digital Labs Team
  • What We Do
    • Teaching
    • Services
    • Products
      • Appatella
    • Portfolio
    • Tutorials
  • Latest
    • General
    • Jobs Board
    • Our Team
    • Products
    • Software Development Services
    • Digital Labs Portfolio
    • Teaching
    • Live Projects
  • Jobs At DigitalLabs
  • Contact
You are here: Home / Archives for Our Team / Yusof's Diary

Yusof's Diary

I'm Yusof Bandar 2nd Year Computer Science Student currently on a Summer Internship with Digital Labs for 3 months. Throughout my time here I will be uploading weekly diaries detailing my feelings and thoughts. Keeping a diary allows me to reflect on what I have achieved during the internship and to share my experiences with other students and devs

September 17, 2018 By Digital Labs Admin

Yusof’s Final Week Interview

Week 12 Interview

It’s Freshers week here at Manchester Met and summer is officially over, which means that our amazing intern Yusof has reached the end of his time with the DigitalLabs Team. The project is finished and the software is ready to be handed over to the client. Before he left to start his final year as a Computer Science student, I spent some time with Yusof asking him about his time as a member of our team.

What have you enjoyed most about your time with the DigitalLabs Team?
I’ve always enjoyed programming, so programming every day five days a week has been really really fulfilling. Really awesome. Going through the whole process. Going from wireframing a system, to developing it and then this week finishing it off has been a really fulfilling process. It’s not something you really do in university. I think that’s been the most enjoyable. Also being part of a team and going to work every day. It adds more meaning to your life than just uni and going in and out. I think that’s been one of the best things.

Now that you’re starting your final year, what advice would you give to first and second year computer science undergrads?
That’s an interesting one. It’s interesting that I never got advice from anyone. I think I was the only one in my whole year that chose computer science as a degree at university. I think the biggest thing is don’t just rely on learning from university. University is going to teach you, so say you learn Java in your first year, go out and do extra stuff and try and learn more than what’s given. Even if you don’t know why you’re going to be using that, you’d be surprised how learning one thing will apply to something completely different. I think for me I enjoyed JavaScript as a programming language so I randomly did that as a hobby and I never realised that as a summer intern that I’d be doing JavaScript as well. Having a solid base of JavaScript helped me perform in the three months of the summer internship. So I would say that my first piece of advice is to carry on learning stuff, even if it’s just reading articles or reading more stuff. I think that’s always an extra thing.
Other advice – Just try to enjoy it. I think that there’s parts of computer science that you’re not going to like and that are going to be really boring and there’s going to be parts that you are going to like and it’s getting that balance right. Enjoy the stuff that you like and the bits that you don’t like, just deal with them and make sure that you can perform them both. I think they’re the two things I’d say.

If you spoke to other second year students, would you recommend doing a paid internship or do you think they should be partying and enjoying their summer?
It would be nice to enjoy your summer and party, but I think internship 100%. The interesting thing is that the university and a lot of other places push doing a whole year internship, which is a great thing as well, but if you don’t want to do a whole academic year you can then just do a summer internship and still do three months of solid work, rather than take nine months. Summer internships are the great middle ground of not wanting to do a year but still wanting to do something that’s more than just two weeks of work experience, which doesn’t really mean much. A criticism is that three months is not a lot compared to nine months but then you’d be surprised how much you can fit in five days a week. If you put in the work in three months, then you’re going to get a lot out of it. I think 100% everyone should do a summer internship.

Was it helpful that the internship with DigitalLabs was paid?
Yes. I think that just within the computer science / software engineering field having a none paid internship is rare. Having it paid makes you take it a little more seriously. It almost becomes a real job, something that is real. Its nice to get paid. Comparing to mates who don’t work and are having fun on their summer, but then you know that you’re getting paid for what you’re doing so there is that and if in your third year you live by yourself you’ve got extra cash that can be spent on stuff.

Did you find it useful having to go through the recruitment process for the job in DigitalLabs?
Yes. Interestingly when I first applied, I didn’t realise that there was going to be an interview. I thought it was going to be just apply with your CV and you either get it or not, so I was surprised initally that there was going to be an interview, but I was like OK that’s a regular thing. That was like my second or third interview in my whole life. It’s not something I do regularly. I think 100% it was useful. I think interviews are just a thing that the more you do the better you get at it, you just get used to it. I think it’s been as useful as doing the internship. The thing about applying for internships and applying for jobs, you just do the interview and you either get it or you don’t and you just try to improve from that last interview. The recruitment was exactly like applying for a real job, I think that was the biggest thing. You’ve got to get a CV, you have to send a cover letter, then it was an interview then you either got the job or you didn’t. It was also quite an interesting interview. It wasn’t necessarily the easiest interview, there were a lot of questions. I wasn’t expecting any technical questions, but there was and that’s something you have to be prepared for. It’s a technical job, so you’ve got to be prepared for technicality. People need to know that you can code and that’s the biggest thing.

Do you think that your time with DigitalLabs is going to be helpful to you when you leave uni and start a full time job?
Yes 100%. Step one just having something on your CV that’s legitimate experience rather than a random or university project. It’s saying that I’ve actually worked with a real company. Interestingly I think that the bigest benefit will be the social aspect. Actually working in a small team with everyone trying to work to one idea, one project, it’s different than working on a university project. It’s a whole different dynamic between those. Working in a small company and hitting deadlines and having the pressure of clients. Obviously your programming skills get better, mine have got much better over those three months, but you can learn that, you can teach that, but working as a team and hitting deadlines is much harder to teach and I think that’s what you really learn from that and take away.

What did you find were the challenges whilst you’ve been with us – if anything?
Other systems on the development project. This one I think technically had three or four new technologies that I had to learn in seven weeks development so that from day one has been a bit of a challenge and you’ve got to stay on top of things You can’t spend a week learning something, it’s not going to work.

I think that when you look at going to university you go in for three or four hours and then you’re done and you’re not even going in five days a week. Just working at something five days a week , waking up at 7 O’clock in the morning and going into work and then staying for seven or eight hours a day, just that has been challenging in itself. A straight three months. You’re not going to get a break, it’s just solid work. The biggest challenge is probably just that. Real life work experience.

Did working with DigitalLabs give you any insight into working as part of a small team?
Yes. The interesting thing is that obviously in computer science first year and second year, you have group projects with people, who are maybe really unreliable or really just don’t care. There’s always different types of people, but when you’re working at a job, everyone is caring and everyone is putting in their effort and working towards the same goal, so there’s a whole completely different dynamic, a completely different way of thinking and working wth a group.

Did you learn anything new or any new skills during your time with DigitalLabs other than the one’s you’ve learnt as part of your degree course?
New technical skills, like stuff on full on authentication to creating REST APIs, two big things that you never actually do in Computer Science. They teach you how to think like that and then you just learn it yourself. I think also being able to communicate what problems you’ve had and what issues you are having with your code . When Dave and I were having issues, I had to communicate 200 line pieces of code within three minutes to explain what the problem was and how to solve it. If you had an issue that was going to take a week, how were you going to talk to the other team members and make sure that you break that down and then you can solve it in half a week. I think that’s a big thing whereas in university you have time on your side, so you don’t really have those issues.

How did you feel about publishing your weekly diary on the DigitalLabs website?
The diary was interesting. It’s an interesting thing because it’s not a normal thing to do or have as part of a summer internship and it was quite interesting and quite enjoyable actually in some ways.

One thing is that now when you start looking back at the diary, it’s a lot more fulfilling than when you’re actually there, because you start seeing all the things you’ve written about and what you’ve done and no doubt as time goes on you’re going to look back on it and get more enjoyment out of it. The best thing about the diary was a way for you to look at what you’ve done in the past week, or two weeks and see what you’ve learnt and what you felt. In many ways it’s a really useful thing and maybe it’s something that should be more common in computer science. You think of computer science internships as just programming and that’s it, but it’s a lot more. It’s a lot more social, you learn a lot from that.

What was it like working in a team where you were a lot younger than everyone else
I think that’s quite interesting. When I first joined I knew that I was going to be the youngest and I was completely prepared for the idea of just working, going in and out and quite quickly it was quite enjoyable, quite nice – all of us went to the pub, all of us did things after work even though there was quite a large age gap. Everyone’s old enough to be my father but you learn so much more from that I think, you’ve literally got 30 – 40 years of experience, probably more totalled up and sometimes just listening rather than always voicing your opinion can be so much more useful. You hear other people say what they’ve done and how people have progressed from different jobs.

This will be the first time that I’ve worked with people who are considerably older so it’s actually been a lot more enjoyable than I expected and I think that’s really cool. The most interesting thing is that you start realising that we have all these different common grounds and maybe different opinions about them. You find common things even though there is an age gap. There’s always going to be different ages when you’re working, there always is, you get used to it and you get past, you just find those common grounds which I think is really quite interesting.

What was it like having a client to work with?
Computer science is one of those degrees where you almost don’t want to work with clients, you choose it so that you only work with the most technical people and everyone understands what you’re talking about. Some computer science jobs are like that and you don’t have to work with clients. Working with clients can be quite a challenging thing, because all of a sudden you’ve got to completely change the way you talk and approach things, you can’t talk technically, there’s no point, it’s not going to work. At the same time it’s incredibly enjoyable. Computer science can be one of those things where you never really show people what you’ve done because people aren’t going to understand how good this algorithm is, but with clients you can literally every day see the progression. You can see how they like stuff and how they dislike stuff, even though it might be getting a little bit annoying if they can’t see you changing stuff, actually that’s what keeps it enjoyable. You have the feedback loop, the constant changes and that constant improvement at the same time. I think it’s like chaotic and order, which is really interesting and I really enjoyed that.

Has it been good having someone from the research team coming in and seeing you most days?
Yes. I didn’t think that I would enjoy it as much as I did. It has been good. I forget how many times you see the client, it was nearly every day for about three months so you start to build this really interesting relationship. it’s been one of the most rewarding things. now you’re seeing how they could use it and the ways they’re thinking that they could use it you know that you’ve created a product tht’s helped someone. I think that’s the biggest thing, the most enjoyable part of it.

What do you think will be your favorite memory of working with DigitalLabs?
That’s quite a hard one. It’s quite hard to pinpoint that to a specific moment. It might be the first time that the actual system was working as one and I remember Laurie and I looked at it and we were messing about with it, playing with it and all of the sudden we started to see how this could be used and what it could be used for and there was this moment, where we started to realise that we could apply the system to anything and anyone who has time series data capture graphing. I think that was my most fulfilling moment at the time. You went from first week of wireframing, designing and this is what the system could be and you don’t know where it’s going to go to, all of a sudden we’ve got something now. I think we both realised at that point that we both had something solid and that was a really really enjoyable point.

Was there anything about working at DigitalLabs that you didn’t expect?
I think how in-depth and fulfilling it was to be part of a team and work every day. I’ve obviously worked at random jobs whilst at uni and had summer jobs but when you work on something you really enjoy and you’re really enjoying every day all of a sudden going to work and waking up becomes quite enjoyable, quite a nice thing. It’s really quite fulfilling and meaningful. I think that’s been the most unexpected thing, even after three months it still doesn’t feel like a job. It still feels like its a fun place and you forget that you’re still doing something quite real. I think that’s been the most fulfilling thing. I expected the high of getting a summer internship to depreciate after two months but it hasn’t it’s stayed up and got even better. I think that’s the biggest thing. I remember getting my first job at Tesco when I was younger, it was awesome to get a job and start earning but I think it was within the first month and I was –  why did I get a job? I have to wake up in the morning every day, no one else is working and you’re stuck at 6 o’clock in the morning at Tesco so I was expecting a similar process and it really wasn’t and I think that shows a lot about what I want to do in the future and what I want to be.

Is there anything else you’d like to add?
Don’t underestimate the value of a summer internship. I think people say that it’s only three months, but three months is actually a long period of time. Eight hours a day, five days a week, if you calculate it. All of a sudden it becomes a huge amount of time and it’s not just technical experience. I was comparing my programming skills from before the internship to now and they’ve just dramatically increased. I didn’t know anything about Angular.js which was building single page web apps and now I feel like I’m really confident in that, which is apparently quite a rare thing. Doing something the same, every day, five days a week, programming and working with a team, you realise how much time that adds up to and how quickly you can start getting stuff done. I think that’s been the most fulfilling thing. I almost forget that this is the last week and it’s quite a sad thing.

Another surprising thing is that I didn’t fully realise how small the team was, but at the same time how much you can do with four people. You realise the value of one person. A lot of summer internships are very focused and you’re part of a massive team doing maybe one tiny thing, but on this summer internship I literally did everything. I went from wireframes, user stories and designing the thing to wrap up. I got basically a cross section of the whole development process, which is really quite a rare thing and very rewarding. Usually you just focus on maybe the back-end or the server or the front-end so I think having a cross section of everything made it really fulfilling.

In computer science we never do front-end and we never do design, colours or that stuff, we just focus on back-end usually and all of a sudden I’ve got an understanding of UI design from Dave who has a lot of background in UI and obviously now I’m looking at things differently. Tiny things like that, which you know that you’re going to use in future projects or personal projects and I think that’s one of the most interesting things.
Filed Under: Our Team, Yusof's Diary

September 7, 2018 By Yusof_DigitalLabs

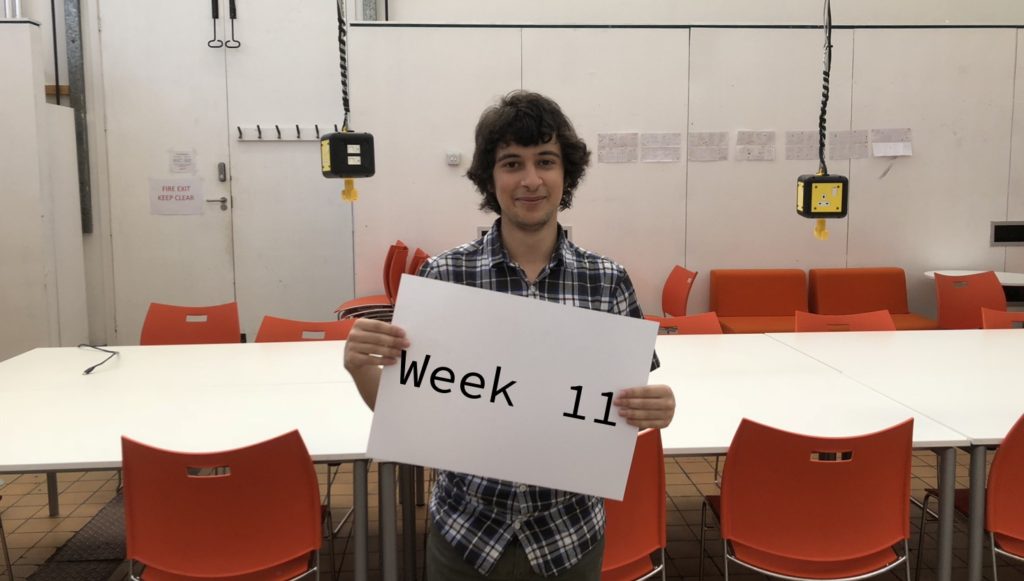
Eleventh Week at DigitalLabs

Yusof Week 11

Second Week Testing

This week focused on finishing the last couple of features and testing. Development is coming to an end thus some of the extra features have been moved to out of scope. Both the OneDrive login and import panel have been reworked, allowing multiple OneDrive accounts to be used.

The Plan Will Work?

Before starting development the largest concern was the relatively short amount of development time, 6 weeks, for such a large project. Having only 6 weeks forced us into an “only core features” corner, removing any unessential features, leaving us with the purest form of the system. Using Trello each feature was planned out within the 6 weeks following a simple but effective template.

Each week of development time will correspond to one sprint, each sprint is a Trello list. Each sprint list will have a corresponding Pending and Done list, indicating which features are currently in development or completed respectively. Additionally, the Out of Scope list holds all the features which have chosen to be unessential, in total the Trello board contains 24 lists. Using Scrum for Trello, a Trello extension, I estimated the number of hours each feature would take, once a feature was completed I would document the actual number of hours the feature took. In the end, the Trello board will provide a full diary of development.

According to the plan the development time would take an estimated 160 hours or 4 and 1/2 weeks leaving approximately 2 weeks of extra development time. Breaking down the 160 hours, I predicted the largest task, Search Pages and View Page, would take a total of 79 hours on the other hand Authentication and Search Page UI, the smallest tasks would take a total of 17 hours. The two weeks of extra development time would be planned out closer to the time.

I love it when a plan comes together, well this plan didn’t, not at all. A combination of the dreaded unknown unknowns and the popping of extra features pushed back development time by a number of weeks, sprint 8 was the predicted finishing time the actual finishing time was roughly, sprint 10. The first two weeks of development, sprint 4 and 5, focused on the backend implementing each endpoint and database queries. In total the sprint 4 and 5 took me an actual of 75 hours, 17 hours quicker than the predicted number of hours. Development time for the backend was quick due to earlier preparation, the weeks leading up to development time I had thoroughly investigated each API and the authentication flow minimizing the chance of an unknown, only minimizing, the inevitable did happen. On sprint 5 an ECONNECTRESTET error occurred tagging 3 extra hours of development time, you can read here how I fixed the issue.

I was hopeful for future sprints, continuing with the same rate of progress I would finish the whole project even earlier, I would soon learn the harsh lessons of software development. Akin to earlier sprints, the start of sprint 6 development was relatively smooth completely finishing the import panel, implementing the search on the other hand was a whole different fight. The first major unknown occured, a jsTag bug, followed by the back button breaking totalling in 13 hours fixing bugs rather than development. In total sprint 6 took 41 hours instead of the predicted 21. A similar story persisted throughout the sprints 7 to 10 on average development time took 15 hours longer than expected. My hard-fought software development tale is not a unique one it is the nature of the beast, development is incredibly hard to predict, the most common reason software fails, its important to make the plan flexible reducing the chances of a break.

In addition to unknown bugs, minor changes and features were added between sprints 9 and 10. When a new feature is added to the plan I first labeled it as an extra feature, secondly using scrum I predicted how long development time will take. If an extra feature could not be completed it was moved to the Out of Scope list clearly showing to the developers and client which features are not within the plan. Overall a total of 12 features were added ranging from UI changes, dynamic axis labels, to new API endpoints, file storage logout endpoint.

Release and Issues

Every day, with the exception of Monday, a new version of the system has been released allowing both developers and clients to see the progress being made each day. Last week Version 0.1 of the system was released by the end of this week version 0.1.5 will be released.

With each new release comes a corresponding release note, detailing the changes made and bug fixes. For example version 0.1.1 release note, read here, outlines one major change, annotation operations are persistent, and three bug fixes. Each bug fix links to a closed GitHub issue which provides more issue detail and the fix.

Mentioned last week with the release of Version 0.1, 22 issues were found this week an additional 15 were added, soon the Github issues list will be too unruly to navigate. To combat the unruly nature of the issues list I first ensured each issue followed a similar structure. Each issue contains three parts:

  • The current behavior, detailing the issues behavior,

  • The expected behavior, how the system should act

  • How to reproduce the current behavior, the steps needed to reproduce the issue.

Having a consistent structure ensures each issue contains all the necessary information, aiding the developer to efficiently fix an issue.

Furthermore, a number of Github Issues labels were used to quickly describe the issue as well as group similar issue types together. When a new issue is added it is first tagged with the appropriate labels. If a new label is needed, a new label is added either by the client or the developer. Similar to the issues list if too many labels are created using them effectively can easily become unruly.

For the Github Issues list, the labels fall into three main categories:

  • Type of Issue

  • Main Version

  • Location of Issue

The type of Issue falls into three subcategories, bug coloured red and the rest shades of blue:

  • Bug, the features current behaviour is not what is expected

  • Enhancement, a whole new feature to the Single Page Web Application (SPA)

  • UI-Change, a minor change to the SPA UI

The location of Issue falls into 3 three subcategories coloured shades of green:

  • Search Page, issue occurs on search page of the SPA

  • View Page, issue occurs on graph view of the SPA

  • Annotation Panel, issue occurs on annotation panel on the view page

  • SPA, issue occurs everywhere

A single issue is always tagged with a main version, type of issue and location but may be tagged with a number of subcategory labels. One example is the “Control Reminders“, this issue is tagged with a version number and location and two types Enhancement and UI-Change.

All the labels can be viewed here, take note of the number of issues.

In addition to adding issues, many issues were closed so far 10 issues have been closed, take a look here

Conclusion

This week the Issue list still seems to be growing everyday but all features have been completed. System releases will still continue next week as well as testing. Furthermore, as next week is my last week all documentation and handover will be complete.

Filed Under: Our Team, Yusof's Diary Tagged With: audience:Student, issues

September 3, 2018 By Yusof_DigitalLabs

Tenth Week At Digital Labs

Week 10

First Week Testing

This week started with me completing the view pages url state integrating D3 with url state and moved to me fully testing the application. This was my first time using GitHub Issues to maintain the issues list and performing a release.

D3 and Url State

One of the core functionality of the Single Page Web Application (SPA) was the ability to store the page state within the URL. The seventh week at Digital Labs I explained how to store the search page state within the URL and the common mistakes made, following this tutorial I attempted to maintain the state of the view page. The largest difference between the search page and view page was the view page graph used D3, a whole different eco-system which wasn’t built to store its state within the Url. Never the less, after 2 days of solid work I finally stored the: runs being viewed, trends visibility, active trend, zoom level, and pan and offset co-ordinates within the URL. Below I will explain how to integrate D3 to work with URL state.

Within the function, D3 calls when the user zooms, for me, it is called zoomed, the URL state needs to be updated with the new zoom vector if the user is zooming. Simply stringify the transformation object, encodeURI to be safer than use the $state object and go method to invoke a new transition.


functionzoomed(){
   //detect if user is zooming or panning.
   if(zooming){
       //transformation object
       vart=d3.event.transform;
       
       //convert object to string
       t=JSON.stringfy(t);
       
       //url encode string
       t=encodeURI(t)
       
       //invoke transition, the '.' indicates same location
       $state.go('.',{
           transitionVector: t
      })
  }
}


Note that the parameter transitionVector is dynamic, the state does not reload.

Check out Seventh Week at Digital Labs State Page Stored in URL section to see how to set dynamic parameters. Check out Eighth Week At Digital Labs Zooming and Panning section to see how to check if a user is zooming not panning.

After a zoom has been detected and the URL updated, the URL parameters needed to be extracted to transition the graph. To extract the URL parameters the $stateParams object was used, simply parsing the $stateParams transition property.


//check if there is a transitionVector param in the url
if($stateParams.transitionVector!=undefined){
   //parse JSON string
   vartransitionVector=JSON.parse($stateParams.transitionVector);
   //transition graph
}


To transition the graph D3 provides us with a handy zoom.transform method which invokes a zoom event with a specfic transition vector. The example below details how to use the zoom.transform.


function(transitionVector){
   svg.call(zoom).transition()
.call(zoom.transform,d3.zoomIdentity)
.translate(transitionVector.x, transitionVector.y)
  .scale(transitionVector.k);
}
​

The same process can be used when the user offsets the graph, except you will notice that calling a second transition will interupt the first. Luckily a transition invokes an ‘end’ event when a transition ends. The example below peforms the transitionVector transition then the offsetVector transition only when the tranitionVector is complete.


function(transitionVector, offsetVector){
   svg.call(zoom).transition()
.call(zoom.transform,d3.zoomIdentity)
.translate(transitionVector.x, transitionVector.y)
  .scale(transitionVector.k)
      .on('end',function(){
       //perform offset transition
  })
}
​

First Time Testing

Version 0.1 of the system was released this week, both the Search Page and the View Page could be fully tested by the clients and I. When testing if an issue was found with the release, the issue could be marked down using Github Issues, each issue is tagged appropriately either as a bug or a wanted enhancement, marking it closed when I fixed the issue. Using Github issues is a common standard for recording issues, allowing developers and users to track certain issues as well as their priority. Furthermore, via Github Issues the client and I could communicate in the form of comments for a specific issue, for example when testing annotations.

The client discovered the annotation re-position and description edit buttons were not working thus the client registered a new issue. To resolve the annotation button issue I first attempted to reproduce the error, in all 3 attempts both buttons worked, vai Github issues I communicated back to the client asking for the exact steps taken including which browser and the version number is being used whilst describing the exact steps I took to test both buttons. The client responded with the exact steps and the browser in use, I quickly relised the client used Firefox rather than Safari, my chosen browser. Using Firefox I finally reproduced the error, once the error was fixed I closed the issue describing the new annotation behaviour.

In addition to the client testing, Dave and I for a couple of hours performed our own tests. We explicitly tested each features functionality, for the whole system, reporting an issue, when found, to GitHub Issues detailing how to reproduce it. Some of the issues found ranged between UI bugs,”Odd sidewards excess scrolling“, to more serious “Offset line verticalises“. In addition to reporting bugs, Dave and I reported if any enhancements were needed, enhancements could be as simple as UI changes, “Lock Icon can be Ambiguous” to new whole features ‘Toggling Runs and Trendlines‘.

Furthermore, for each feature, we discussed the UI design and the expected functionality, we realized that many elements of the UI were cumbersome and unintuitive. When a Ui change was needed, before reporting onto GitHub Issues, we first debated what would be a better alternative. One example where the UI was cumbersome was with annotations, first, each annotation button functionality was ambiguous, second to edit an annotation it took too many clicks than needed. To improve the annotation buttons UI each button would include a tooltip describing the functionality and to reduce the click count we redesigned how editing an annotation would work.

Going through the application in this manner taught me a great deal about the app’s functionality plus I learned a totally new way to look at UI design. In the end, the application was completely torn apart exposing each individual flaw resulting in a long list of bugs and enhancements reporting each one onto GitHub Issues, totaling 22 individual issues. Take a look at the issues list, each issue is tagged with a version number.


Communicating With Clients

Throughout my internship, we maintained a constant relationship with the clients meeting nearly every day discussing changes made and if any, issues. Maintaining constant communication with the client has been vitally important to the development of the system, allowing us not only to catch changes early on but to ensure the client understands the limits and functionality of the application. I learnt that if the client does not remain in the loop while development is happening the client can easily lose any understanding of the application a common mistake when working with clients.

Mentioned earlier this week version 0.1 of the system was released allowing the client to test the application, since we were in constant communication with the client, the client easily picked the application up and started testing. Allowing the client to test the application substantially aids in the development, increasing the likelihood a bug will be found and if an enhancement is needed.

Coinciding with version 0.1 release, release notes were written up. For every release of the system there will be an associated release note. A release note describes the functionality of the application, changes made and bugs fixed. Each release note is shared between clients and developers. For version 0.1 the release note described that only the search and view page are functional and how to test each specific feature, this extra communication channel with the client helps the client to develop a better understanding of the application. Take a look at the version 0.1 release notes especially the Example Tests section.


Conclusion

I learned a great deal this week how to test an application thoroughly. Testing was scary but enjoyable, tearing the application apart focusing on each features functionality and UI. Next week is the second week of testing, dealing with the most crucial bugs first and enhancements.

Filed Under: Our Team, Yusof's Diary Tagged With: audience:Student, D3 and URL state, testing

August 24, 2018 By Yusof_DigitalLabs

Ninth Week at Digital Labs

Yusof Week 9

Development – Final Week

Most of the time spent this week was continuing development on the view page as well as fixing minor bugs with the search page. The Single Page Web Application (SPA) is now fully deployed on Heroku which allowed us to test the application on an iPad, which works perfectly.


More on D3 Zoom

Last week time was spent implementing the visualization using D3. One of the main features of the visualization is the ability to pan and zoom to compare data features, this was fully implemented last week. This week I carried on developing the pan and zoom perfecting its functionality.

When using d3.zoom() for each zoom transformation d3 will return the current transformation. The transformation a contains 3 properties:

  • transform.x translation amount along the x-axis,
  • transform.y translation amount along the y-axis
  • transform.k the scale factor.

D3 will calculate each new point for every element that is within the zoom selection, this causes problems when only one element needs to be zoomed. One solution is to only re-render the elements that need to be zoomed this is only a temporary solution if the user selects to zoom all elements all the previously none rendered elements will jump to the new position.

A better solution is to have two transition vectors one for the selected elements and one for the non-selected, this means that relative positions can be maintained.


Setting up Heroku

Once the main aspects of the view page were complete, it felt like a good time to host the two APIs, database and Single Page Webb Application (SPA) on Heroku, allowing the client to test the search import and view processes for the first time.

Heroku is platform as a service (PaaS) which allows any developers to run application entirely in the cloud, supporting multiple languages.

Deploying to Heroku took a surprisingly long amount of time than expected, below I explain how to host an application on Heroku.

When a Heroku account has been created a new application can be set up. Heroku usually has two methods to perform actions either through the CLI (command line interface) or the dashboard (website). Before using the CLI first it must be downloaded, to CLI can be downloaded either via brew – Mac – or downloading a dedicated installer for your os.

Once the CLI has been successfully installed any type of an application can be set up. This time I will only be describing how to set up a Node application, but others follow a similar process. Within the local folder, containing your  Git repository, run the command

heroku create [choose an application name]

this will create a git remote associated with the local git repository, called Heroku. If no application name is supplied Heroku will generate one randomly.

Finally, run the git push Heroku master command, this will automatically install all the necessary dependencies and deploy your application. Once an application has been deployed running the Heroku open command will open the website within the default web browser.

It is important to make sure that your git repo is set up correctly, Heroku will by default look with the root the repo for a package.json file which should contain all the needed dependencies and the startup script. Below is an example of a package.json file.


{
   "name": "Singe Page Webb Application",
   "version": "1.0.0",
   "description": "The back button is broken",
   "engine": {
       "node": "10.5.0"
  },
   "dependencies": {
   "angular-typeahead": "^1.0.2",
   "express": "^4.16.3",
   "path": "^0.12.7"
},
   "scripts": {
   "start": "node src/server.js"
}
}


If your package.json is not within the root of the repo this article explains how to configure heroku to look within a subdirectory. Heroku has mutiple articles for more more information on the initial setup of an application – take a look.


Environment Variables

Environment variables are used to describe aspects of a Node application. Unlike global environment variables, env variables are used for a specific node process usually defining port numbers or specific URLs. To add a new property to the env object, which is a property of the process object, each property can be appended before running the application.


PORT=8001 node app.js


Appending each env property before running the application can easily become cumbersome, a better solution is to create a dedicated env file. An env file contains a JSON object with each property an env variable.

Twilio has a great article on using environment variables in the node, describing the basics to alternative methods.

The two methods to set up environment variables on Heroku is either through the CLI or the Heroku dashboard. The first thing to mention is Heroku calls environment variables config vars, using the CLI the Heroku config command will list all the config vars. To add a new config var, use the Heroku config: set followed by a key-value pair, to remove a config var use Heroku config: unset followed by config key.

To modify the config vars from the dashboard navigate to the app’s setting tabs, under the config var selection config vars can be added, edited or deleted.

Accessing Heroku config vars from the Node application is exactly the same as accessing environment variables, for example, to get the app’s PORT config var with process.env.PORT.

When running the Heroku application locally to access config vars Heroku will automatically read an env file ‘each name/value pair is inserted into the environment, to mimic the action of config vars.’. The example below demonstrates how to copy a config var to the env file.


heroku config:get PORT -s >> .env


Reflection

This week is the last week of development – equally a sad but fulfilling one. Throughout the 9 weeks, 4 of them have been spent investigating and designing and the other 6 have been development.

I have learned a huge amount about how to take a concept and turn it into a fully working system, this was my first time designing a whole system using Trello to document the process and Pencil to wireframe each part. It was definitely hard to jump straight into the deep – but extremely enjoyable developing my understanding of how a small company operates as well as how easily a system can fail, and what to put in place to stop it.

 I learned how to effectively communicate with clients – again my first time – it has been extremely gratifying showing them each phase of the process. For 9 weeks I have met with the client, for 10 minutes, nearly every day discussing the process and any changes needed. Especially within the fourth and fifth week of development a few extra features were requested. When a new feature is added I document a ‘change request’ and predict how long it will take to develop. Only then I can decide if there is enough time.

Programming every day has greatly improved my core Javascript and also my understanding of AngularJS. Throughout the development time I had to quickly learn new technologies; Swagger, AuthO and D3. Swagger was used to implement the two APIs, AuthO to implement the authentication process and D3 to visualise the time series data.

Conclusion

Overall the 6 weeks of development has been extremely rewarding especially seeing the visualisations fully working. Some of the elements of the SPA still need development which will push back debugging and testing by a couple of days but I am confident all the major bugs have been ironed out. After the two weeks of debugging the last week is left for handover and documentation.

Filed Under: Our Team, Yusof's Diary Tagged With: audience:Student, Heroku

August 20, 2018 By Yusof_DigitalLabs

Eighth Week At Digital Labs

Yusof Week 8

View Page

This week completely focused on the view page, using D3 to build the time series graph and annotations. Since this was my first time using D3 the start of the week was much slower compared to previous weeks. The graph visualization panning and zooming, as well as annotations display and the ability to edit them, are fully complete, luckily no unknown unknowns have popped up.

D3

D3 stands for Data-Driven Documents, allowing developers to present data using HTML SVG and CSS. Unlike other data visualization libraries D3 works by giving you a set list of components to build any type of visualization wanted, many other visualization libraries lockdown to very specific visualizations with specific properties. This can be extremely problematic, the developer relies heavily on a set feature list but with D3 the core components provided can be used to build any specific feature such as panning on one axis.

D3 works by manipulating the Document Object Model (DOM) according to the given data, using a combination of select and modify methods. The select method is D3’s most basic but most useful, allowing the selection of the DOM either by tag, class name or id name. Once an element has been selected a child element can be appended or an attribute can be set or get. Using only the select method a developer can iterate through an array appending an h1 tag to the body as well as styling each tag independently. The example below demonstrates how to select all div tags and colour each div background red.

<html>
   <body>
       <div>
           <h1>
            Hi
           </h1>
       </div>
       <div>
           <h2>
              Hi there
           </h2>
           <h2>
              How are you
           </h2>
       </div>
   </body>
</html>
d3.select('body')
.selectAll('div')
  .style('background-color','red')


First the select statement searches the DOM and selects the first occurrence of the body tag, second, the selectAll statement selects all div elements within the body and finally, the style adds a style attribute to each div setting the background color to red.

One thing to note about D3 is a selection method typically returns the current selection or a new selection allowing methods to be easily chained. By convention, if a selection method returns the current selection use four spaces to indent if a new selection is returned use two spaces of indentation.

D3 is a powerful tool but with great power comes great responsibility. D3 takes considerably long time to build a visualization but when used correctly responsive, intuitive and beautiful visualizations can be built. The best example of D3 is The New York Times 2013 Obama’s Budget Proposal visualization, inspecting the element you can view the core elements used.

D3 Graph

To build the time series graph D3 was used, this whole week had me working closely with D3 slowly building each component. The first element that needed to be built was the graph itself, akin to past weeks I used a combination of tutorials, D3 documentation and my past knowledge of javascript. Building a line graph within D3 is relatively simple, the graph consists of two main components axis and the line itself.

To build an axis within D3 you first need to specify the scale. A D3 scale maps data to a visual representation (x and y coordinates in pixels), D3 provides multiple methods both for continuous and discrete data. The example below specifies two linear scales and sets their ranges.


//set scales and ranges
var x=d3.scaleLinear().range([0,width]);
var y=d3.scaleLinear().range([0,width]);


After the scale ranges have been set, the domains need to be specified. The domain is the complete set of values when specifying the domain you provide an array of two number specifying the minimum and maximum data points.

The example below uses the d3.min and d3.max methods returning the minimum data point and maximum data point from an array respectively. d3.extent may be used instead, which returns the minimum and maximum values.


x.domain([
   d3.min(data.Xdata),
   d3.max(data.Xdata)
]);
​
//or
​
x.domain(d3.extent(data.Xdata));


The final step is to render the actual trend line using the d3.line method which generates a line from an array of data. Using both the x and y scale specified earlier the line method can generate an svg path on screen.


var line=d3.line()
.x(function (d){
   return  x(d.Xdata);
})
.y(function (d){
   return  y(d.Ydata);
});


Voila, a line graph is built, well almost. You might notice that the trend line is rendered on screen but no axis is this is because we haven’t told d3 to render any axis. To render an axis simply use the d3.axis[position] method specifying the position and scale.


var xAxis=d3.axisBottom(x);
var yAxis=d3.axisLeft(y);

The example below shows the fully how to implement a line graph using D3.

//select svg and specify width and height
var graph=d3.select('svg')
  .attr('width',800)
  .attr('height',500)
​
//graph data
var data=[data]
​
//specify the ranges of the x and y scales
var x=d3.scaleLinear().range([0,800]);
var y=d3.scaleLinear().range([0,800]);
​
//specify to d3 to render x and y scales
var xAxis=d3.axisBottom(x);
var yAxis=d3.axisLeft(y);
​
//specify to d3 how to render the line
var line=d3.line()
.x(function (d){
   return   x(d.Xdata);
})
.y(function (d){
   return  y(d.Ydata);
});
​
//specify the domains of the x and y scales
x.domian(d3.extent(data.Xdata));
y.domain(d3.extent(data.Ydata));
​
//create a group tag and append the x axis
graph.append('g')
.attr('class','axis axis--x')
.attr('transform','translate(0,'+500+')')
.call(xAxis);
​
//create a group tag and append th y axis
graph.append("g")
    .attr("class", "axis axis--y")
    .call(yAxis);
​
//create a group then a path tag and calculate the path definition to be drawn.
graph.append('g').append('path')
.attr('class','line')
.attr('d',function (d){returnline(data)})
​
​

Zooming and Panning

Initially, I predicted that zooming and panning would take a considerable amount of development time instead I completed both the zooming and panning just under half the predicted time mostly due to the in-built d3 zooming capability. D3.zoom method provides a transition vector when the user either zooms or pans, the vector contains three parts a scale, x and y. The transition vector can be used to rescale both the x and y scales appropriately.


function zoomed() {
   var t=d3.event.transform;
   var xt=t.rescaleX(x);
   var yt=t.rescaleY(y);
}


Using both xt and yt variables any component can be re-rendered.

The problem with using D3.zoom is it doesn’t distinguish between zooming and panning, for our graph multiple trends line can be viewed, panning should offset only one trend line whilst zoom should zoom all trend lines. To distinguish between zooming and panning, I compared previous transition vectors to the current one, if the scale component has changed I know the user has zoomed if not I know the user had panned.


//last transition vector
var lastTransitionVector;
​
function  zoomed(){
   //current transition vector 
   var t=d3.event.transform;
   
   //k is the scale component, if not equal to the 
   //last transition vector user has zoomed
   var isZooming=endZoomvector.k!=t.k
   
   if(isZooming){
       console.log('user is zooming');
  }else{
       console.log('user is not zooming');
  }
   
   //update the lastTransitionVector
   lastTransitionVector=t;
}


Annotations D3

Annotations can be built directly using D3 but this can be a long and laborious process, instead I used the d3-annotation library. D3-annotation is a library, built by Susie Lu, used to build responsive annotations.

Using the library drastically sped up the development time clawing back a few hours lost from previous weeks. Building basic annotation is very quick process, each annotation needs an x and y pixel or data co-ordinate. If a data co-ordinate is provided the accessors method can be used to it into an x and y pixel co-ordinate, d3-annotation will take care of rendering process. The example below demonstrates how to create a simple annotation.


const  type=d3.annotationLabel
​
//annotations
const annotations=[{
   note: {
       label: 'Description'
       bgPadding: 20,
       title: 'Annotation'
  },
   data: {
       xPoint: '100',
       yPoint: '20'
  },
   className: 'show-bg'
}]
​
//set up range and domain (not shown here)
​
​
const makeAnnotations=d3.annotation()
.notePadding(15)
.type(type)
//convert data points to x and y pixel co-ordinates 
.accessors({
     x: d=>x(data.xPoint),
     y: d=>y(data.yPoint)
})
.annotations(annotations)
​
d3.select('svg')
.append('g')
.attr('class','annotation-group')
.call(makeAnnotations)


Once a annotation can be rendered on screen, I had to make sure each annotation maintains its correct position when the user pans and zooms the graph. Akin to the time series graph, I used the rescale method to rescale the x scale to calculate each annotation position. The example below demonstrates how to re-render each annotation, the function expects an array of annotations and a transition vector. Its important to remember the d3-annotation library clears all annotations then renders them back therefor if one annotation moves but a second doesn’t both need to be re-rendered.


function   annotationRescale(annotations,t){
   const  type=d3.annotationLabel
   
   var xt=t.rescale(x);
   var yt=t.rescale(y);
   
   const  makeAnnotations=d3.annotation()
      .notePadding(15)
      .type(type)
      .accessors({
         x: d=>xt(data.xPoint),
         y: d=>yt(data.yPoint)
      })
      .annotations(annotations)
}


One of the main features of annotations is the ability to drag each one to a new position. Luckily the d3-annotation provides a drag event calling a function when an annotation is dragged. The function simply translates the annotations x -coordinate to the cursors x-coordinate.

Building the mechanics of the annotations was a relatively smooth process compared to the annotations UI design. In the first few weeks of design I completely fleshed out the UI for the whole system, both the search and import pages followed the UI wireframes, on the other hand, the annotations UI did not. I quickly realized the original design was extremely clunky and would not work well on a touch device, not wasting too much time, Laurie and I designed a better more intuitive system that would scale nicely on all devices.

Conclusion

Overall this week has been very satisfying,taking raw data from a database and displaying it on screen. Due to last weeks, extra features and bugs, development still isn’t finished, all that remains is the tags and columns panel. By next week all features should be complete leaving the rest of the time for debugging and testing.

Filed Under: Our Team, Yusof's Diary Tagged With: audience:Student, D3

  • Go to page 1
  • Go to page 2
  • Go to page 3
  • Go to Next Page »
  • Home
  • Contact DigitalLabs@MMU
  • Digital Labs Team
  • Jobs Board
  • Privacy Policy
  • Twitter

Copyright 2018 - 2020