Using Node-Red to visualise sensor data over the internet without writing code, Part 1
This is the first article in a series from MMU’s Digital Labs looking at ways to empower researchers, students, and academics with powerful tools to aid and augment data gathering and processing activities. We’re using Node-Red, an environment that makes it easy to assemble highly functional logical blocks together to automate data processing without needing to write any code.
Who can benefit from this?
This is meant as a simple introduction to working with flows and connecting a physical sensor to Node-red and sending the data elsewhere. Thanks to the flexible abstraction of Node-red’s approach, the input itself could be almost anything that could be read; this may be devices that connect over TCP/IP or Bluetooth, devices we directly wire into using GPIO, onboard metrics (such as free disk space returned by running a terminal command), or almost anything that can be interfaced and returns a reading.
The aim of this series is to show the general methodology and ways to build on these foundations.
How is this of use to me?
This is illustrative of the basics of data gathering and transmission using Node-red and flow-based systems. Taking these foundations, this example can be adjusted at different elements, from the data gathering, to storage, whilst seeing how we can also add triggering and event response to the picture.
What we’ll be doing
Node-red is a platform from IBM, running on Node.js, for consuming and processing data in real-time. It’s novel in a number of ways; the most obvious is that it takes a visual approach to programming, allowing systems developers to focus on higher-level understanding of the systems they are building and less on writing boilerplate code to handle routine operations, such as authenticating with services and formatting data. By virtue of this, it opens up opportunities to non-technical users to build and customise their own applications without being bogged down in complex and often fiddly minutia of protocols and transactions.
It also exposes the full suite of Javascript and Node.js for more demanding tasks, though, making it possible to focus on the harder parts of technical problems while ignoring much of the boilerplate scaffolding of typical solution building. While a linguistics researcher may not have much expertise in authenticating and consuming data from Twitter, they may have need to gather and process a sample set from the service; Node-Red makes it possible for them to quickly assemble a prototype and see results in a fraction of the time it would take to build a bespoke solution with technical partners. Developers with a more robust technology background could then take that Node-Red programme and develop complex integrations, feeding data into the toolchains and storage systems that the researcher is more familiar with.
By using a flow-based programming paradigm, Node-Red makes the architecture of a system clearer and more flexible. By focussing on how data moves and is transformed through a system, it accelerates the utility of the system itself, allowing data to be repurposed and redirected to multiple outcomes without the overhead of traditional refactoring and architectural changes.
In this series, we’re going to use Node-Red to read data from a sensor and publish it in real-time online, without writing any code. This simple project hides a wealth of opportunities and capabilities behind it; it create a data source that can be read in real-time by multiple clients, using a publish/subscribe architecture (provided by virtue of using MQTT); it shows the basics of reading a sensor from one device, but this could also cover multiple sensors – even multiple devices and instances – all publishing to the same location. The visualisation of this data provides immediate feedback and allows us to determine quickly if the data ‘feels right’ as a guide to whether things are calibrated properly. It will also become clear how this data can be programmatically manipulated and adjusted as needed, and how completely different data sources – using different protocols and interfaces – can be connected and unified into a single system
What we’ll need
We will be using a Raspberry Pi and a GrovePi Kit. Ideally, we’ll have a spare SD Card to install Raspbian (not lite!) onto (which can be burned using a tool like Etcher)
What we’re using
- Raspberry Pi
The Raspberry Pi is a low-cost (£10-£40) computer which runs Linux. It can connect to a range of wireless and wired networks (depending on the model). It is low-power, reliable, and runs from interchangeable SD Cards.
The OS, Raspbian, ships with Node-red by default. - Node-red
Node-red is a system for assembling software from blocks, called ‘nodes’. Each node encapsulates a lot of complex and intensive software development, and hides it, instead exposing friendly interfaces to access their functionality. Nodes can be wired to send their output to other nodes, which allows you to very quickly assemble programmes that send and manipulate data, whether from the internet, online services, sensors, remote devices, databases or other types of storage.
Node-red allows you to focus on the higher-level aim of a project, without getting bogged down in writing code, authentication management systems, data encoding matters, or all the typically time-consuming and tiresome things that typically explode a simple data gathering question into a multi-person-year project that becomes inflexible, brittle and (all too often) almost redundant after delivery.
On a Raspberry Pi running Raspbian, Node-red is a little out-of-date: there are update instructions on the Node-red site, or you can run the following in a terminal:
bash <(curl -sL https://raw.githubusercontent.com/node-red/raspbian-deb-package/master/resources/update-nodejs-and-nodered)
(however, we advise doing this on a spare SD Card running Raspbian, as it currently breaks a few other things)
- Grove Pi
The Grove Pi Kit provides easy connections for attaching a range of sensors and actuators to a Raspberry Pi. It is compatible with a wide range of cheap sensors, from distance to sound, switch, gas and environmental.
We’re using the Grove Kit because it’s affordable, easy to use, and just works directly from the box.
Step 1: Connecting Grove device
Best to do this with the Pi turned off.
Connect your Grove sensor ‘hat’ to the GPIO pins on the Raspberry Pi.
Start up the Pi and open a terminal or log in to it over the network and issue the following command to install the support files needed (taken from the instructions on Dexter Laboratories’ site), run the following command in a terminal
sudo curl -kL dexterindustries.com/update_grovepi | bash
then sudo reboot your Pi.
Step 2: Starting Node-Red
Once the Pi has rebooted, we can log into it from a terminal or remote shell and start Node-red. If you’ve patched your Node-red distribution, enter
node-red-start
in a terminal and press return to start it; we can then hide the terminal window, as it will only show log details from Node-red (which are sometimes very useful, but not today!)
(If you haven’t patched it, the steps are the same, but the command to enter is simply node-red.)
Interaction with Node-red is performed through a browser; due to the constraints of the Raspberry Pi, life will be a lot easier if you can access the Pi from another machine on a network that is a little more forgiving to work on, and the Pi itself can be left as a network server running Node-red.
Node-red’s interface is available on port 1880, so the URL you will need to enter will be
http://raspberrypi.local.:1880/ (unless you access the device through a different hostname or IP address, in which case you will need to substitute raspberrypi.local. for the relevant address.)
Step 3: Reading and Dumping Data
We’re going to read data from a Grove Light sensor and bring that into Node-red as a continuous feed of updated values. We’re then going to dump the value returned in the Node-red interface, introducing the enormously useful ‘debug’ node as we go and getting a simple overview of how Node-red makes data ‘flow’ through the components we assemble.
A brief overview of the Node-red interface
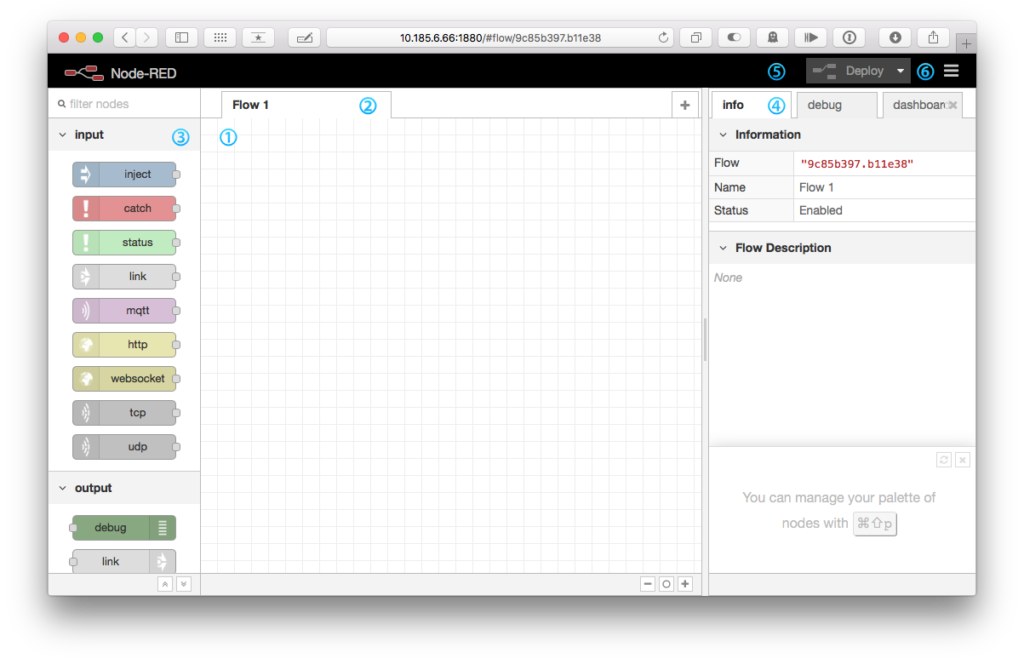
The interface is composed of a several elements.
① Is the flow editor, into which you drag nodes and patch them together.
② Is the flow chooser, where you can choose which of multiple flows you are editing.
③ Is the list of nodes you can use, by dragging them into ① and connecting them
④ Is the information panel, which describes nodes you have selected in ①
⑤ Is the Deployment menu, which you use to send a flow you have edited to the node-red runtime system
⑥ Is the edit menu, where you can manage Node-red’s settings – but most importantly, import and export flows from elsewhere.
General workflow in Node-red involves dragging nodes from ③ onto ①, and connecting their outlets (the grey nodules on the right of a node) to other nodes’ inlets (the nodules on the left). This dictates the direction of flow – the topology, not the layout. An event will typically cause data to be emitted from a topmost node to flow through a patch to the outlet. This event may be a timer triggering, a HTTP request, or a interval-based sensor reading, which is what we’ll be using.
Adding the Grove nodes
Before we can use the Grove Kit in Node-red, we need to add the Node-red layer for accessing it (previously we only added the Raspberry Pi system-level drivers for it).
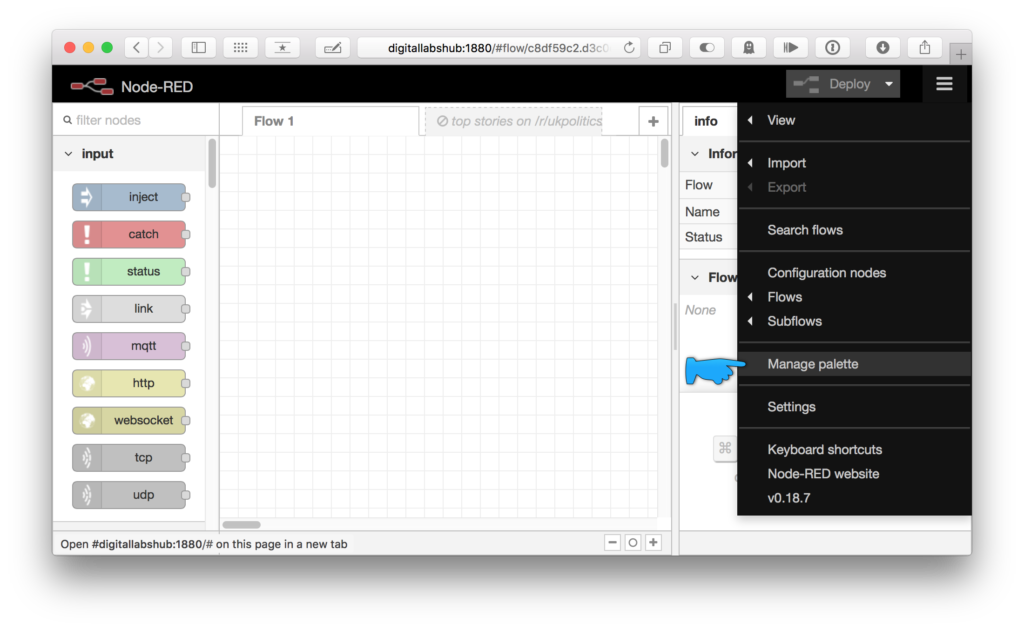
Click ⑥, the three-horizontal-line ‘burger’ icon in the top-right of the Node-red interface, to open the edit menu. Under this, pick the Manage palette item to open a panel labelled User Settings. On the left-hand side of this panel, make sure Palette is picked, if it’s not already, then click the Install tab along the top of the interface.
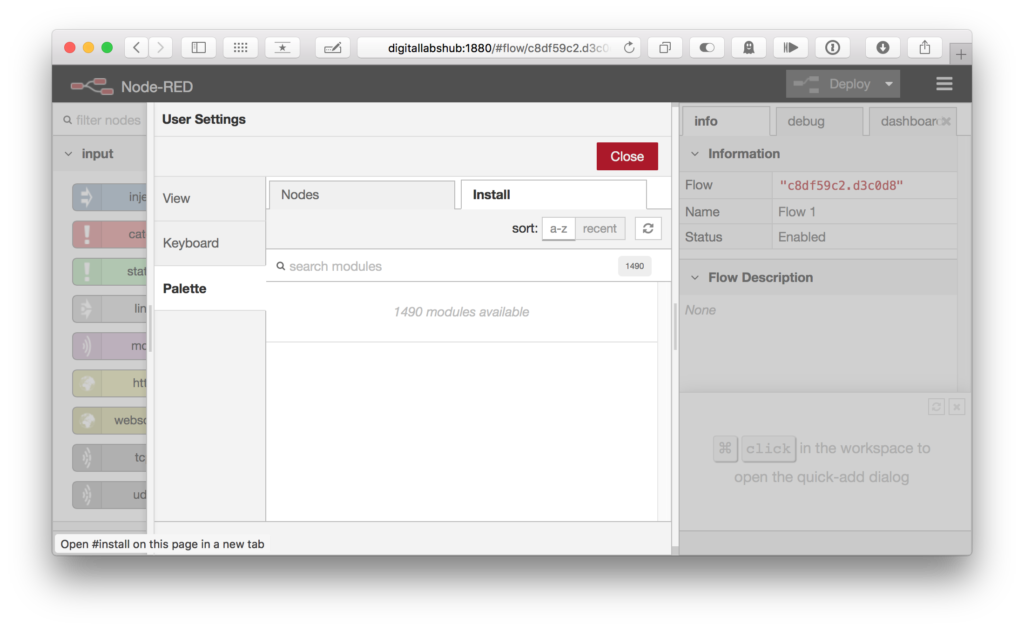
In the box labelled search modules, enter node-red-contrib-grovepi. This will find the Node-red Grove Pi module which will provide the nodes we can use in our flow to interact with the Grove Pi hat.
Click the install button to open an informational modal window, exhorting you to read the documentation (this is standard for all module installation). Click the red Install button, as we’ve taken any necessary steps already.
After a few seconds, a green modal panel will appear telling you it installed several new nodes. This disappears and now we have access to Grove Sensor nodes in the palette. We can click Close in the top-right of the User Settings panel.
Reading data – input nodes
On the Grove board, attach a Light sensor to the input labelled A0 – make sure the connectors are the correct orientation when plugging them in.
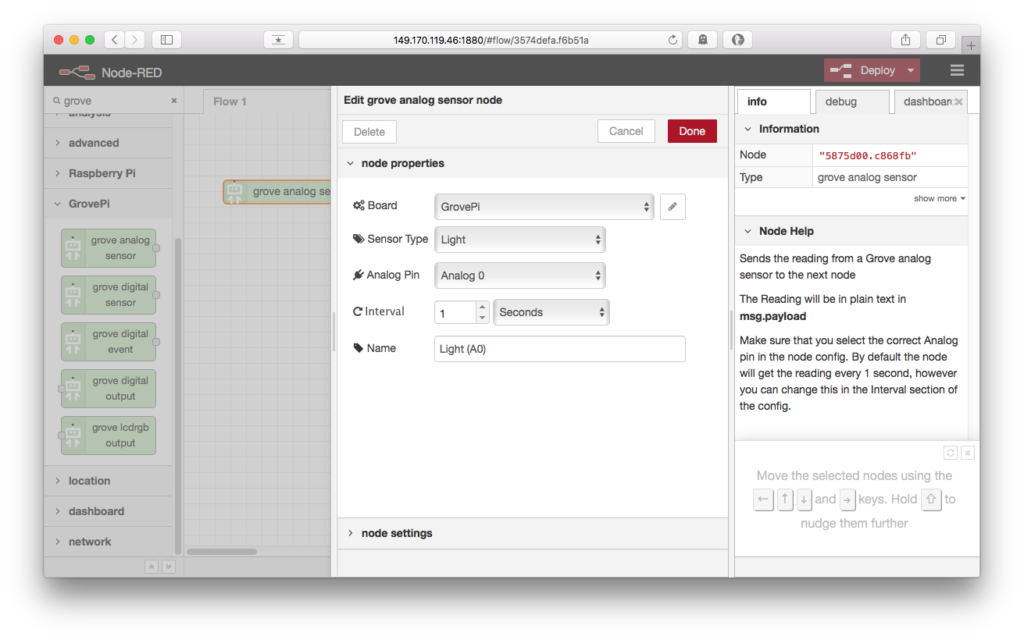
Drag a grove analogue sensor node from the palette to the main flow editor. Double-click it to open its configuration panel, and click the pencil icon by the ‘Board’ item. In the panel that appears, click the ‘GrovePi Board’ drop-down menu, and choose Connected GrovePi Board, then click Add in the upper-right. This associates the connected Grove board with our flow.
Back on the Edit grove analog sensor node panel, set the Sensor Type to Light and check the Analog Pin matches the interface we’re using on the Grove board. We have connected the light to pin 0, so to make this easier to see in the flow editor, we give it a Name of Light (A0). Click Done in the top-right to save this node.
Finally, notice the Deploy button (⑤) has changed in the top-right of the interface, from grey to white-on-red. This indicates several things:
- That the currently running flow is different from the flow in the editor (as we have not deployed any code to the runtime, this is a given)
- That we have made changes in the Flow editor, and
- That we can click the
Deploybutton to send our changed flows to the Node-red runtime.
If we click ‘Deploy’ now, the button returns to grey, indicating there is no difference between the state of the editor and the state of the runtime engine. However, nothing seems to be happening!
Dumping data – debug nodes
Well, data is flowing – but you don’t have to just take our word for that. Let’s build on our flow to show us the data emitted by the grove analogue sensor node.
Drag a debug node (from under the output section of the node palette) onto the flow editor and place it to the right of the Light (A0) node.
To connect the output of the Light (A0) node to the input of the (newly renamed) msg.payload node, mouse over the outlet nodule on the right of the Light (A0) node until it illuminates, then click and drag the mouse to the inlet (on the left) of the msg.payload node, and release the mouse. A patch cord has appeared between two, and the data will flow from the right side of nodes to the left side of connected nodes.
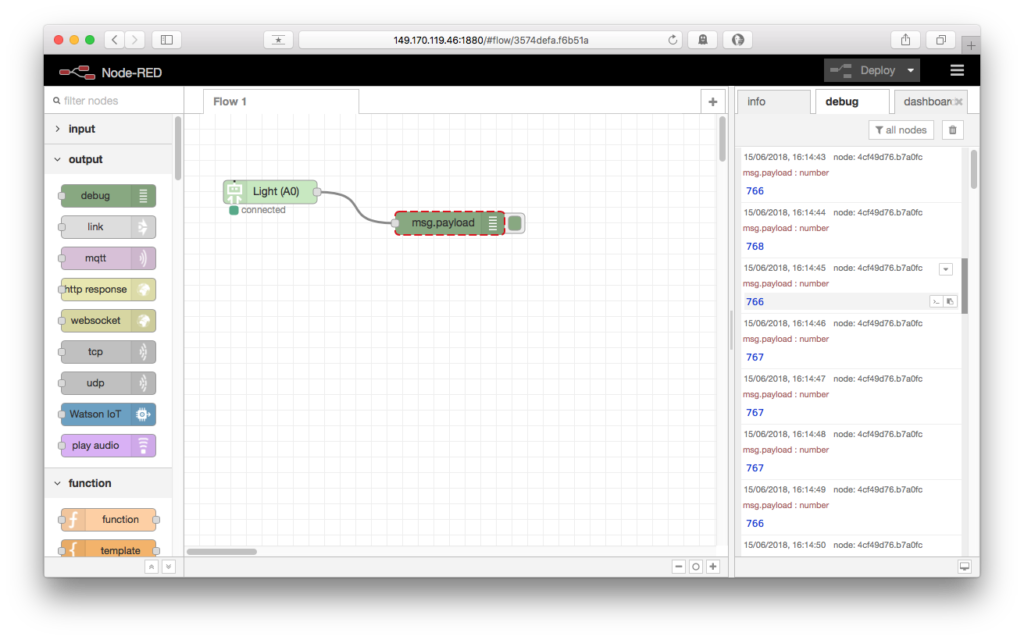
Still, nothing is happening – we need to deploy our code to the Node-Red runtime to see the changes we have made. The editor knows we need to deploy our updates, and has illuminated the Deploy button in the top-right of the interface. Click it to send the new flow, and then click the debug tab on the right-hand side of the interface. Every second, a reading from the light sensor should appear.
Mousing over one of those messages will highlight the node in the flow that it was sent from. It tells us a little about the payload property of the msg object, which is what nodes emit and receive from each other[1]
The debug node is incredibly useful in Node-red as a means to debug what’s happening in a patch. It can be used to emit data at and point there is an outlet on a node, and at any stage in a flow. By clicking the green button on the right-hand side of the debug node, it’s possible to toggle it on and off, which is useful to make it fall silent. This allows you to expand any data it’s dumping and perform in-depth forensic analysis of what’s passing through a patch, or what unfamiliar nodes may be emitting.
What we’ve learnt is that the Grove sensor is emitting a value, every second, between 0 and 1000, and it is sent as an integer in msg.payload.
What have we done: A recap
This has been a fairly straightforward introduction to running Node-red on a Raspberry Pi, and how to read data from sensors attached to a Grove Kit Hat attached to it.
We’ve had an overview of the Node-red interface and know how to build a flow in it, by dragging nodes from the palette to the flow editor and connecting outlets to inlets. We know we can configure nodes by double-clicking them, and sometimes we have to step through multiple panels to achieve this. We’ve seen that the debug node is a useful means to understand the data flowing through our system, which is triggered by an event, which then sends a msg object into nodes who are connected by having a patch cord between their inlets and the nodes’ outlet. This continues, in turn and in parallel, until a message (or messages) reach the end of their connected cords, at which point it is destroyed.
We’ve learnt how to search for, and add, new modules inside Node-red, which provide suites of related nodes.
Finally, we’ve learnt how to put these little parts into use to give us information. In our next article, we’ll start doing more complex things with our data, including sending it to other systems.
If you’d like a workshop or support for your project or department in using Node-red, please contact us through our contact form or email!
- Each node passes on a JavaScript object called ‘msg’. Nodes can attach properties to this object to pass on data for further processing. The ‘payload’ property is a default item used by most nodes; it generally consists of the output of the node immediately upstream, and may be usefully be a JavaScript
String,Number,Array, orObject, in turn, consisting of other datatypes. ↩