Please see Part 1 of this series to take full advantage of this post!
This time, we’re going to do something a little more useful with our sensor.
We’re going to push the data to a real-time publish/subscribe system online, using the Heroku platform. We will take this data and visualise it on a web accessible URL, where we will first present real-time data, and add a one-hour time series graph. We will then expand this into a dashboard, with a feedback message telling us about the light levels as text.
Nearly all of this we will achieve without writing any code, though we will see entry points where we can perform data manipulation if we needed to.
In our final article, we’ll look at long-term storage of this data in MongoDB and ways to trigger external events on reaching thresholds – but that will be in our next instalment.
Step 1: Creating a Heroku VM
Heroku is a ‘cloud platform as a service’ which allows the creation of virtual server (‘dynos’) hosting applications, with minimal fuss. They offer a free tier of service for testing and developing applications, which we will use – however, it requires account owner validation with a credit card. You will need to be able to fulfil this step to continue with this project.
You’ll need to create a user account at heroku.com.
Next, following this link while logged in to Heroku will allow you to create a free instance running Node-red and MongoDB (via). Remember to set the region to a nearby one (likely, EU) and to make a note of the username and password you provide for access to your Node-Red editor.
After a short while, your machine will have been instanced.
We will add an MQTT broker to it: this we will do by clicking ‘Manage App’ at the bottom of the page.
On the next page, click the ‘Resources’ tab and in the search box under ‘Add-ons’, enter CloudMQTT. In the panel that appears, ensure that ’Cute Cat - Free‘ plan to avoid any charging, and click Provision at the bottom of the panel to create an MQTT broker for your server.
You will now have a Heroku server, at http://your-server-name.herokuapp.com/ . It will have Node-red installed and set up with an administrator user and password you have set. You will have access and credentials to a MQTT server at CloudMQTT, and you will also have access to a MongoDB installation on that machine.
Log in to your Heroku Node-red server. You can do this by visiting heroku.com, finding your server on the dashboard, clicking it, then clicking the ‘open app’ button in the top right.
Next, at your heroku-hosted Node-red instance, click ‘Go to your Node-RED flow editor’ and log in with the credentials you provided when you created the machine.
Now we have the Heroku instance up and running, we need to push the data from our Raspberry Pi version of Node-red, and configure it to push data to our CloudMQTT broker.
Step 2: Pushing data to CloudMQTT
CloudMQTT, in this case, provides us with an MQTT Broker. Click the Setting tab on our Heroku instance to provide access details we will need. Under Config Vars is a CLOUDMQTT_URL which provides the connection details we will need – it will be of the form mqtt://username:password@instance.cloudmqtt.com:port. Make a note of this, ideally somewhere it can be copied-and-pasted.
We will need to set up the MQTT Output node on our Grove-wearing Pi, and the MQTT Input node on our Heroku system.
On our Pi, add a MQTT Output node, and double-click it to configure it.
Under Server, click the pencil icon next to the menu that says Add a new mqtt-broker…. In the Add new mqtt broker node panel that appears, add a name of CloudMQTT and in the Server field, enter the details from earlier. For the Topic, enter light – this sets the topic it publish to – and make our lives easier by setting the Name to light also. Connect the output of the sensor node directly to the input (on the left) of the MQTT Output node and click Deploy. The node will now bear a green dot and the message ‘connected’. You are now publishing your data stream to an online MQTT broker under the topic ‘light’.
MQTT? (A brief aside about MQTT)
MQTT (Message Queuing Telemetry Transport) is a mature protocol for real-time, low-footprint message transmission over TCP/IP. It implements a publish/subscribe model, where data is sent with a ‘topic’ (like a UNIX file path), and clients connect to ’ subscribe’ – topics of interest – optionally using wildcards as parts of the topics.
Multiple clients and publishers can connect to the same topics, and all receive updates and events in near real-time. There is much more to MQTT; it’s worth exploring in its own right, as demand for it will only increase as IoT and bandwidth-constrained systems multiply.
Step 3: Receiving data from CloudMQTT
Let’s go back to our cloud-hosted Heroku Node-red instance (if you don’t still have the window available, then just log in to the Node-Red Heroku instance using the ‘Open App’ button at the top-right of the Heroku dashboard page for your node red instance, and authenticate with the details you provided when creating the instance earlier.)
Drag a MQTT Input node to the flow editor. Double-click it and repeat the same steps as earlier to configure the MQTT broker, using the same URL as we used on the Raspberry Pi. Keep the topic the same – ‘light’ – to subscribe to the same message queue – and give it a Name of light so we know what it’s for.
Wire a ‘debug’ node in by connecting the output of the MQTT Node to the input of the debug node and click Deploy in the top-right. In the debug panel on the right hand side of the window, you will see an updated light level from the Raspberry Pi every second – you can mute these updates by clicking the rounded green button on the right-hand side of the debug button on the flow editor (now labelled ‘msg.payload’) when you’re satisfied it’s working.
Great! We’re now pushing data from one device, on a private network, to a remote MQTT broker, which is available over the public internet, and consuming it though your internet-based Node-red system. Next, we’ll make this data a little more accessible.
Step 4: Building a dashboard
On our Heroku Node-red, click the edit-menu hamburger (in the top right) and pick ‘Manage palettes’ again. This time, we’re going to install the node-red-dashboard module (Palette on the left, Install at the top, remember?). This will provide us with a set of nodes that create a dashboard of controls and interface elements, at the public URL of http://your-heroku-instance.herokuapp.com/ui/ (which means anyone with this URL can see and interact with these controls – no login is needed, so be mindful what you expose here!)
Back in the Node-red flow editor, and at the bottom of our node palette (on the left-hand side of the main Node-Red window), a new ‘dashboard’ section has been added. Find the ‘gauge’ item and drag it onto the main flow editor. This will provide a new URL on our Heroku server at which we can see visualisation and interface controls for managing our application, without having to provide access credentials.
Double-click this node to access a ‘Edit gauge node’ panel. Click the pencil icon by the ‘Group’ item then click the pencil icon by the ‘Tab’ item on the panel that appears next. On this page, accept the defaults and click ‘Add’ in the top-right. This takes us back to the previous ‘Add new dashboard group config node’ panel. Under ‘Name’, enter Sensors then click ‘Add’, in the top-right, to return to our initial panel, where we were editing the actual gauge node configuration.
On this panel, the defaults are fairly reasonable; we should change the Name to Light, to describe what it is, and change max to 1000, knowing that the range of the Grove sensor is 0→1000, then click ‘Done’ in the top-right.
We can then drag the outlet of the ‘light’ MQTT node to the inlet of the ‘light’ gauge node. If we deploy this updated flow, nothing seems to happen – until we visit the /ui path on our heroku server (eg, http://myherokuservername.herokuapp.com/ui). Our light sensor is presented with a real-time visual gauge.
Drag a ‘chart’ node from the node palette on the left to the flow editor, and connect the output from the ‘light’ MQTT Input node to the input of the new chart node. Click ’Deploy' in the top-right, and check the UI URL from earlier – a graph has appeared. Back in the Node-Red Flow editor, double-click the graph node. While it uses fairly smart defaults, we can give it some hints by changing the Y-axis Min to 0 and Max to 1000, and give it a Label and Name of Light Series and light chart respectively. When we re-deploy it, these changes are immediately reflected in the UI URL.
Data processing and logic, Node-red style
In this step, we’ll take the light level, but instead of showing the raw value, we’ll do some decision-making with it. We’ll convert it into a text message depending on the value and route that message to a UI Text element to display it. This will show our first node that has multiple outlets and how data flows under these circumstances.
Drag a ‘switch’ node from the palette to the flow editor and connect the output of the ‘light’ node to its input. Double-click the ‘switch’ node to edit it.
A switch node looks at a property of the inbound msg object and runs logical tests against it, sending the output to a corresponding outlets if the test evaluates to true for them (it can also be configured to stop after the first match, or to have a default case if there are no matches).
In Property, make sure we’re looking at msg.payload – this is the default option.
Our first rule will be for values that are numerically lower than 500.
Set the drop-down menu to < and in the drop-down menu next to the “az” label, choose 09 Number. In the text area beside it, type 500.
Click ‘+ add’ at the bottom of the panel to create a second rule.
Set this to match values >= 500. Notice this has an item labelled ‘→2’ to the right of it. Each new rule we create will add another outlet and forward on the message to the matching outlet(s) (which can be change using the drop-down at the bottom of the panel set to ‘checking all rules’).
Click Done in the top-right to save the configuration for the switch node. In the flow editor, this node now has two outlets, the top one corresponding with our first rule (is msg.payload less than 500?) and the lower one corresponding with our second rule (is msg.payload greater than or equal to 500?).
From the palette, drag out a ‘change’ node. Change allows us to transform the properties of the msg object. We will use two of these nodes, the first connected to the first outlet of the match node, and the second – you guessed it – connected to the second outlet. In the first, double-click it and change the configuration (under Rules) to ‘Set’ msg.payload to the string ‘Dark’ (you will need to check the drop-down menus to ensure you are, in fact, changing the msg properties, and you are setting it to a string value. In the other change node, do the same thing, but change msg.payload to ‘Light’.
You should now have the top outlet of switch patched into the inlet of the first change node (the one that changes msg.payload to Light), and the lower outlet patched to the inlet of the second change node, changing msg.payload to ‘Light’.
Finally, add a ‘text’ outlet node from the dashboard section of the node palette (it has the letters abc underlined on the right) to the flow editor. Double-click it and confirm it’s using the Sensors [Home] Group we created earlier. Set the Label to Visibility. and click Done.
Patch the outlets of both the change nodes to the inlet of the new text’ node. As only one logic condition will route at a time, they will not compete for control.
When you Deploy, the UI URL will have a new ‘Visibility’ field that describes the current light level.
The use of the switch/change nodes is a very flow-centric way of handling a logical transformation, and a traditional if/else statement, that may seem rather convoluted to non-patch based programming models. There are some benefits to this approach, through. By creating multiple diverging and converging routes, it’s possible to attach more nodes and functionality to each path; for example, we could add a node that emails us when the ‘low light’ level condition is reached, or even build more complex logic there (only send us one a day).
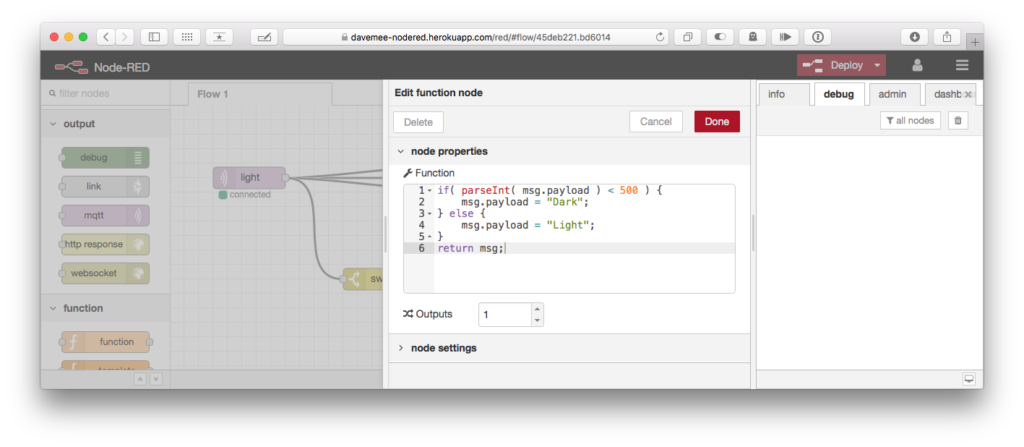
Sometimes, however, you Just Want To Write Code. The function node lets us do this – we can write JavaScript in there. Our code is given the msg object, we manipulate it, and then we finish by returning the transformed (or same) object – a simple return(msg) when we’re done.
Let’s recreate the switch/set structure as a single function node. Drag out a function node, send the output of light to its inlet, and the outlet of function to the visibility UI Text output node (delete the connectors from the two set nodes by clicking them and pressing the ⌦ [or Backspace] key on your keyboard).
The Function contents in the function node should be set to:
if( parseInt( msg.payload ) < 500 ) {
    msg.payload = "Dark";
} else {
    msg.payload = "Light";
}
return msg;
This is fairly straightforward JavaScript; we change the msg.payload value according to the value of the inbound msg.payload object, and return the whole msg object when we’re finished.
Set the Name to dark/light (or any other useful reminder, if you’ve taken the code in a different direction!).
Notice at the bottom there is the option to send multiple Outputs from the node. We’re not using this here, as we do all our logic in one fell swoop, but it by returning an Array of msg objects (rather than a single object), we can route our output to multiple places at once (and by setting any one item in that list to a null value will skip that outlet sending any data).
We click Done and
In review …
We’ve worked through a number of new elements – not only about patching and nodes, but also the overall architecture of publish/subscribe models and system design.
We’ve learned how to instance a lightweight platform as a service Node-red host on Heroku, and create an MQTT broker with it. We’ve adapted our existing flow to publish data to this endpoint, and subscribed to the same data source on our Heroku installation. We’ve build a dashboard showing a single value and a time series. We’ve looked at simple decisionmaking in flows to put a textual message on our dashboard, two ways – the first using pure Node-red nodes, and the second using the function node to embed arbitrary functionality written in JavaScript into our flow.
In our final articles, we’re going to look at more ways of using Node-red for sensor reading, from long-term storage to event triggering and finding new mechanisms to read data.
If you’d like a workshop or support for your project or department in using Node-red, please contact us through our contact form or email!