• Skip to main content

DigitalLabs@MMU

Digital enterprise at Manchester Metropolitan University

  • Home
  • About
    • Digital Labs Team
  • What We Do
    • Teaching
    • Services
    • Products
      • Appatella
    • Portfolio
    • Tutorials
  • Latest
    • General
    • Jobs Board
    • Our Team
    • Products
    • Software Development Services
    • Digital Labs Portfolio
    • Teaching
    • Live Projects
  • Jobs At DigitalLabs
  • Contact
You are here: Home / 2018 / Archives for June 2018

Archives for June 2018

June 28, 2018 By Zebra

Take a peek at the Quantified Digital Labs Environment!

finding the configuration nodes menu


Open the dashboard directly

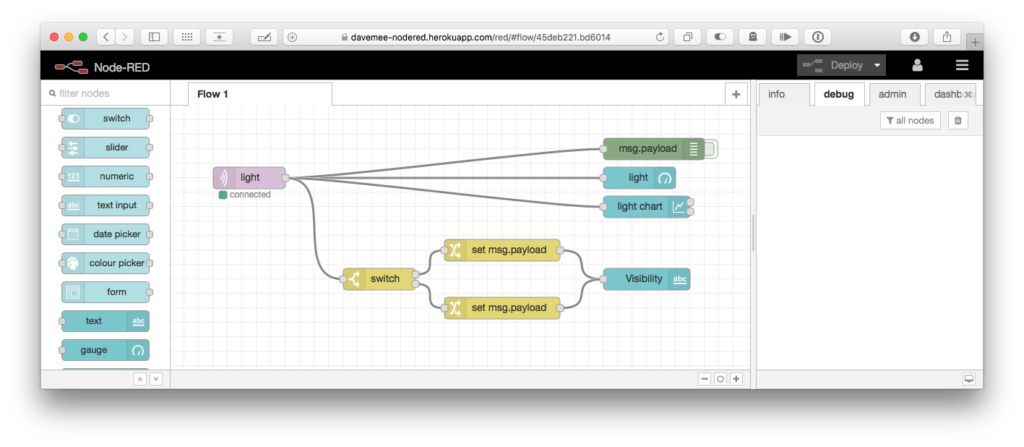
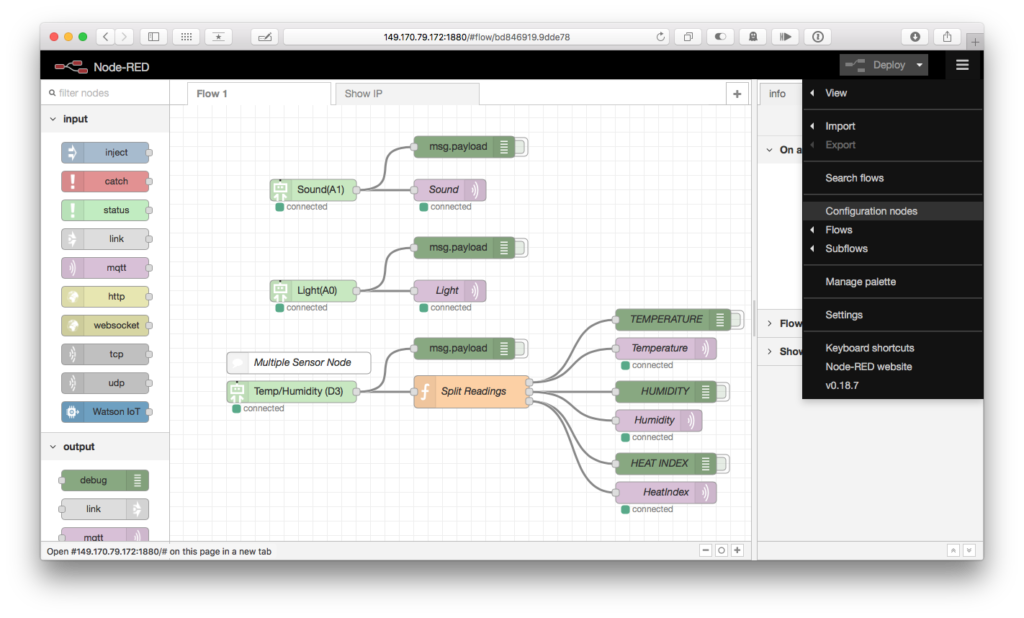
Here’s a quick dashboard we put together with Node-red and the Grove Pi+ sensor kit. We built a little on our previous project to pull in more environmental data, but by using our Heroku platform (with its bundled CloudMQTT broker) we have a free, web-hosted dashboard we can access from anywhere.

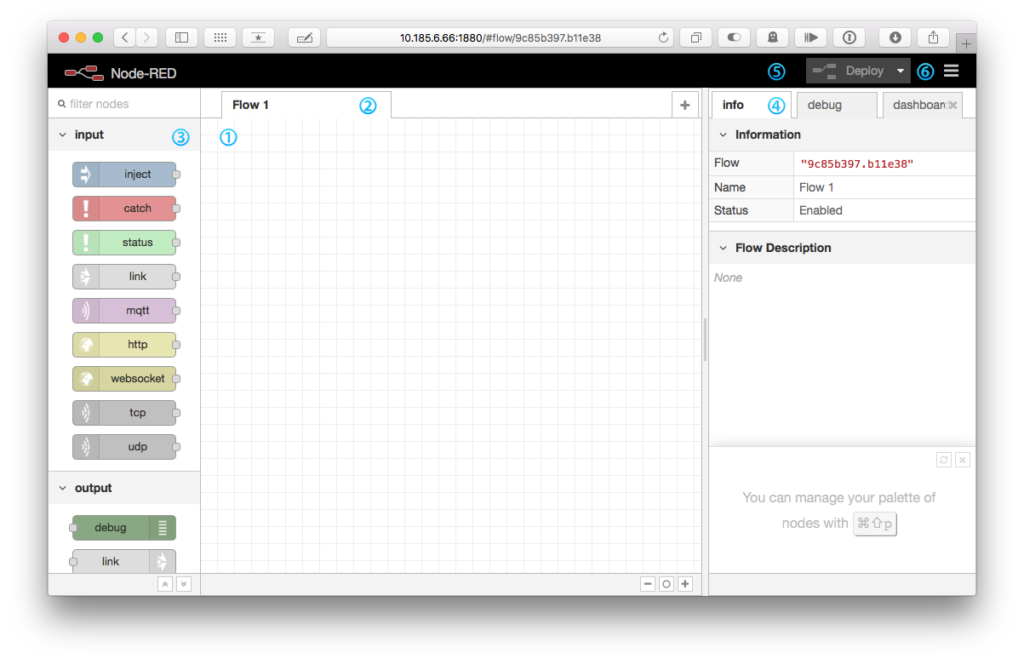
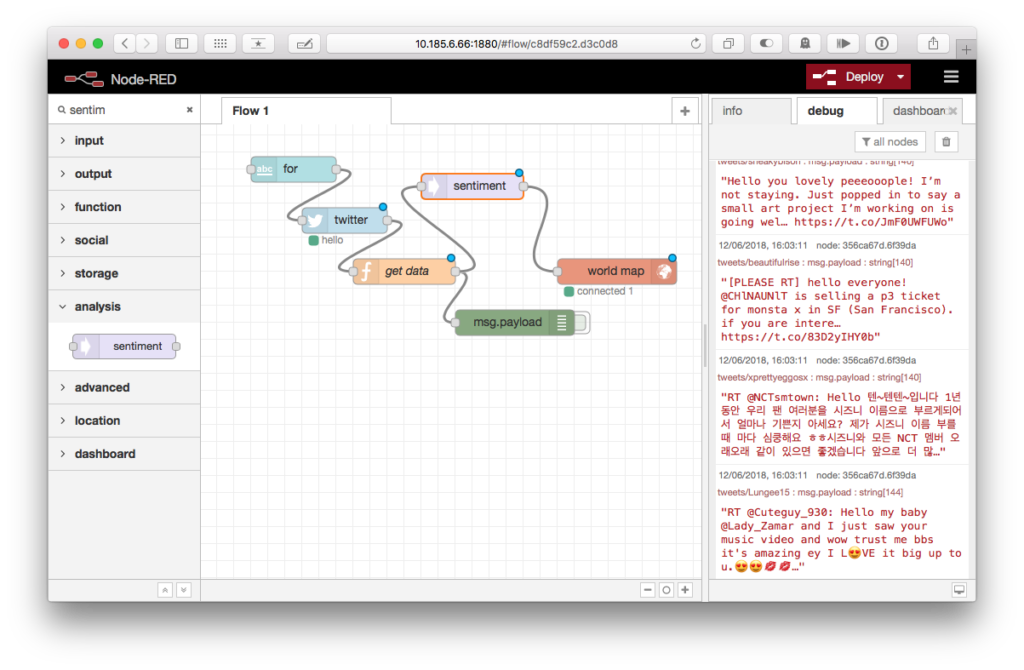
This is part of our series on Node-red; If you’d like to see more, see our Technology for Non-technologists post, or our series of posts on Node-red and sensors. [Read more…] about Take a peek at the Quantified Digital Labs Environment!

Filed Under: General, Tutorials Tagged With: audience:Researcher, environment, grapes, Grove, Heroku, monitoring, MQTT, Node-red, patch-based programming, Physical Computing, Raspberry Pi, Sensor, UI

June 21, 2018 By Zebra

Using Node-Red to visualise sensor data over the internet without writing code: Addendum – MongoDB

DigitalLabs

Please see Part 1 and Part 2 of this series to take full advantage of this post!

Connecting to a MongoDB storage system

In this article, we’re going to take our Heroku-hosted flow and store inbound light data in a MongoDB instance, provided by Heroku when we provisioned our machine.

We’ll look at online and desktop tools to query our database and extract our data. [Read more…] about Using Node-Red to visualise sensor data over the internet without writing code: Addendum – MongoDB

Filed Under: Tutorials Tagged With: audience:Researcher, Heroku, MongoDB, Node-red, Tutorial

June 21, 2018 By Zebra

Using Node-Red to visualise sensor data over the internet without writing code, Part 2

using switch and set

Please see Part 1 of this series to take full advantage of this post!

This time, we’re going to do something a little more useful with our sensor.

We’re going to push the data to a real-time publish/subscribe system online, using the Heroku platform. We will take this data and visualise it on a web accessible URL, where we will first present real-time data, and add a one-hour time series graph. We will then expand this into a dashboard, with a feedback message telling us about the light levels as text.

Nearly all of this we will achieve without writing any code, though we will see entry points where we can perform data manipulation if we needed to. [Read more…] about Using Node-Red to visualise sensor data over the internet without writing code, Part 2

Filed Under: Teaching, Tutorials Tagged With: audience:Researcher, dashboard, Grove, MQTT, Node-red, patch-based programming, Raspberry Pi, Sensor, UI

June 20, 2018 By Zebra

Using Node-Red to visualise sensor data over the internet without writing code, Part 1

Using Node-Red to visualise sensor data over the internet without writing code, Part 1

This is the first article in a series from MMU’s Digital Labs looking at ways to empower researchers, students, and academics with powerful tools to aid and augment data gathering and processing activities. We’re using Node-Red, an environment that makes it easy to assemble highly functional logical blocks together to automate data processing without needing to write any code. [Read more…] about Using Node-Red to visualise sensor data over the internet without writing code, Part 1

Filed Under: Teaching, Tutorials Tagged With: audience:Researcher, Grove, Node-red, patch-based programming, Raspberry Pi, Sensor

June 18, 2018 By Zebra

Computing in a data-centric world: How can non-technologists make headway?

Node-Red flow: analysing Twitter sentiments

We find we’re living in an increasingly data-rich world; our data lakes feed the data we harvest and fill our data silos and data warehouses with; it dissipates into the cloud and pours back down to grow anew.

Accessing this data is becoming harder and harder, though; even with GDPR, many systems require extensive manual work or navigating arcane, computer-science based API interfaces. Even instruments and sensors insist on network or hardware interface controls to access their goods.

Once the data is got, it’s another ordeal to do something with it; to publish it, convert it into something a familiar tool can use, or even let you know when a long duration activity has run it’s course or a certain number of samples have been collected.

While we’ve spent great effort teaching computational thinking and using Microbits and Raspberry Pis, we think we’ve missed a trick; we’ve sweated the details, but ignored the bigger picture – how do we get data from that to this and make a record of it, without spending and involving a huge team of specialists?

We think we have you covered.

Data, Not Programmes

Node-Red flow: analysing Twitter sentiments

Node-Red is a system for working with flows of data, rather than writing programmes, as in traditional computational applications. Systems are built by dragging nodes onto a page and connecting their inputs and outputs, rather than by writing reams of syntactically structured code. Changes can be made and tested easily, and data can be used in multiple different ways without significantly impacting existing systems.

Node-Red is lightweight and can even run on a £10 Raspberry Pi. With a huge number of pre-built expansion modules available, the basics for most activities are already in place, whether that’s gathering data from FitBits or environmental sensors, to publishing data to Amazon or physical actuators.

Data-driven systems and their applications

Researchers may already have workflows that could benefit from some automation; others may be trying to find ways to realise systems that they can just about see but are beyond their funding and technology reach. Here we’re going to look at a few applications where Node-Red can provide an easy solution to realise previously challenging, expensive, or resource-demanding applications.

Social Data analysis

We have access to some extraordinary social and publishing tools. Twitter provides a real-time interface between writing and global publishing, which has been a remarkable asset for a number of unexpected applications.

  • Public health monitoring, disease outbreaks, and disaster prediction
  • Disinformation campaign analysis

Collating specific datasets or samples is a challenging activity with social media; the data is sent in realtime, then disappears; storage costs become large quickly without whittling down the inbound messages. Node-Red makes all these activities easy.

Data Journalism

As machine-readable and open data becomes prevalent, journalism is finding new ways to make use of this tool to understand events and tell stories. Tasks such as plotting data on maps, over time, can still be extraordinarily challenging, however, as our tools have not caught up to the kinds of time-based, geolocated, and multivariate data we have to work with, still steeped in two-dimensional spreadsheets.

Internet of Things, Smart Cities, and Smart Homes

Node-Red excels at working as the intelligence layer in systems automation. As our emphasis shifts to maximising power usage, our devices are outsourcing their intelligence to ‘the cloud’, where online systems perform the analysis and storage work that would have taken place on-device a few years ago. Node-Red natively provides access to messaging and real-time data access, making it an ideal platform to provide not only the backbone to smart systems, but providing the hooks to integrate them with larger systems and big data and machine intelligence applications.

  • The Things Network uses Node-Red for consuming and pushing information to smart sensors and devices over LoRaWAN
  • Smart Smoke alarms have been piloted to reduce the cost and false-positives for GMFRS

Instrumentation and data-gathering

Traditional tools for interfacing with hardware and sensors are expensive and limiting. They require specialist knowledge and expertise, as well as on-going licensing costs. Node-Red, Raspberrys Pi, and cheap microcontrollers work incredibly well together, reading data not only from network interfaces but also serial interfaces and GPIO pins.

Embrace the flow!

We’re really excited about the potential of this tool to transform how research and design can approach computational tasks. It’s cheap, forgiving, and immediately responsive.

At Digital Labs, we’re planning a number of workshops to support your activities with Node-Red, and develop custom functionality that may fit your specific demands. Please talk to us or get in touch through our contact page to discuss ways we can help.

Filed Under: General, Software Development Services Tagged With: audience:Researcher, Data, IoT, Node-red

  • Go to page 1
  • Go to page 2
  • Go to Next Page »
  • Home
  • Contact DigitalLabs@MMU
  • Digital Labs Team
  • Jobs Board
  • Privacy Policy
  • Twitter

Copyright 2018 - 2020